The Wash. Short for Ground Zero. Tue 30 May 2023

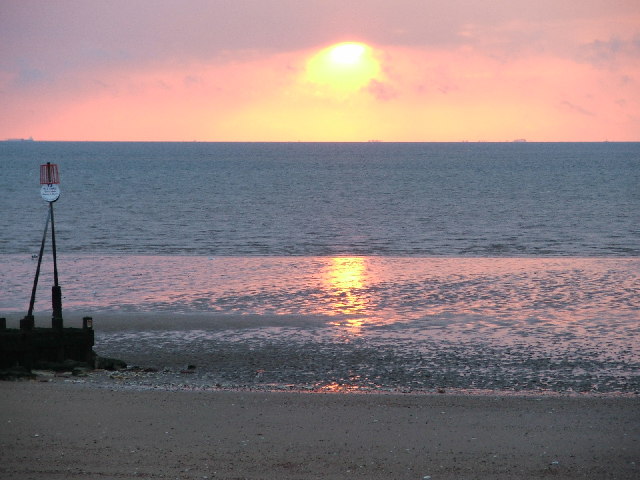
Sunset over the Wash, England. Source: The Wash/Kim Barker
St Enodoc's church looks half buried:

And in the middle of nowhere. Source: St Enodoc’s Church: A Church Buried Under the Sand
St Enodoc's is a mile away from its nearest congregation, the village of Rock. And further from the next nearest congregation, the village of Trebetherick.
From St Enodoc's Church, Trebetherick:
From the sixteenth century to the middle of the nineteenth century, the church was virtually buried by the dunes and was known locally as "Sinking Neddy" or "Sinkininny Church".
St Enodoc was dug out of the sand in 1863.
Sand still looms over it:
View from the south east. Source: St Enodoc’s Church: A Church Buried Under the Sand
From St Enodoc Church:
the clergyman had to gain entrance through a skylight, made especially for that task. The south porch is the only entrance to this church, so that must have been buried in sand.
They mean this entrance:
St Enodoc's south porch. Source: Google Maps
Remains of another building have been found under nearby Brea Hill - another sand hill. Perhaps the sands around St Enodoc cover many other lost structures. A settlement lost beneath the sand would explain why St Enodoc was built in the middle of nowhere.
Historians blame the Atlantic for 'sinking' St Enodoc. They say Atlantic winds covered the church with sand blown from north Cornwall's nearby coast. 1
However, about the same time sand was covering St Enodoc - between the 16th and 19th centuries - patches of sand were covering parts of eastern England. Especially around the fens.
And unlike St Enodoc's, the fens don't face the Atlantic.
One patch covered much of Santon Downham, a village in Suffolk. The sand's height is marked by a brown brick inserted into the tower of Santon Downham's Church of St Mary:
The brick is 6m (20ft) above ground. Source: Santon Downham St Mary
Santon Downham is a long way from St Enodoc. And it is not on the Atlantic coast.
It's not on any coast:
St Enodoc's left; St Mary's right.
Accounts of Santon Downham's 'sand flood' are eye-opening. The BBC interview in Desert Islands of Eastern England discusses some of the details and evidence left by Santon Downham's sand flood.
St Mary's is a little taller than St Enodoc but it was covered to about the same height. About half way up its roof:
St Mary's door would also have been covered. Source: Santon Downham St Mary's Church
Something like this:

Did it sink? Or did the ground rise?
Put simply, for not entirely explicable reasons, both structures were covered with enough sand to be unusable but not completely hidden. And not destroyed.
Santon Downham isn't the only eastern England church that 'sank'. It's one of 11 reported 'sunken churches' in eastern England.
Their locations present us with an under-investigated enigma:
It's a geologic cluster.
Key:
- Red marker: Documented 'sunken' church
- Orange marker: Legend of 'sunken' church
Folklore claims sunken churches 'disappeared into the ground'.
In four documented cases, the ground rose around the church. Two of these we know about: Sand floods over St Enodoc in Cornwall and over Santon Downham in Suffolk.
We also know north Lincolnshire's sunken church legend was deliberately changed into dragon 'folklore' in around 1911. Along with the village's name.
And we know Cumbria's Black Coombe sunken church site is covered by an 'ancient' stone circle today. A stone circle no different to any other fake stone circle 2.
These are just obvious efforts to smudge folk memories of sunken churches. To uncover the secret they really hide, we can look more closely at eastern England's arc of sunken churches.
If the arc has a centre point, drawing diagonals and finding their midpoints may show us roughly where it is:
Midpoints suggest a more westerly centre to the arc.
Key:
- Black marker: Midpoints of line between opposite sunken church locations
The midpoints cluster near each other.
The Dragonby - Lidgate 'diagonal' doesn't look like a diagonal. From here on we'll ignore it.
The five remaining midpoints have a centre about a two kilometres (a mile or so) beyond the River Nene's outfall.
Let's unclutter the map:
Approximate centre of east England's 'sunken church' reports.
Key:
- Blue marker: Averaged centre-of-arc
Curiously, the centre of the circle is close to the lowest settlement in the United Kingdom: Tydd St Giles.
The sea-level village of Tydd St Giles.
Tydd St Giles is at sea level. It's beneath hide tide level.
How does this strangely low-lying area relate to the various reports of 'sunken churches'?
We draw two circles:
Churches sank - or the ground rose - between the green and white circles.
Key:
- Blue marker: Centre of white and green circles
- White circle: Inner edge of sunken churches zone.
- Green circle: Outer edge of sunken churches zone.
All eastern England's known 'sunken church' reports come from between the green and white circles. The distance between the two circles is 26 miles:
- White circle diameter: 112km (69 miles)
- Green circle diameter: 200km (124 miles)
- Width of 'corridor' between circles: 44km (26 miles)
To draw this, we had to nudge the centre of the circles a little. Their centre is now 2.8km (1.7 miles) south-west of our first estimate. The first estimate was averaged from sparse data so we expect to do this.
Ten out of 11 sunken church reports come from the outer half of the 'corridor' or doughnut formed by the green and white circles.
It's easy to see this if we divide the green sunken church 'corridor' into two:
Ten churches sank - or the ground rose - in a 13-mile wide corridor.
Key:
- White circle: Inner edge of sunken churches zone.
- Green circle: Outer edge of sunken churches zone.
- Blue circle: Centre of sunken churches zone.
Almost all eastern England's sunken churches fit into the corridor defined by the rims of the blue circle and the green circle. Put another way, their reports come from the outer edge of whatever events occurred here.
The one exception is St Mary's Church in Santon Downham, Suffolk. Indicated by the red marker at about 5 o'clock, that's the church that during the 17th century became partially flooded beneath 6m of sand.
If you were searching eastern England for more sunken church reports, you might check the outer, 13-mile wide green corridor first.
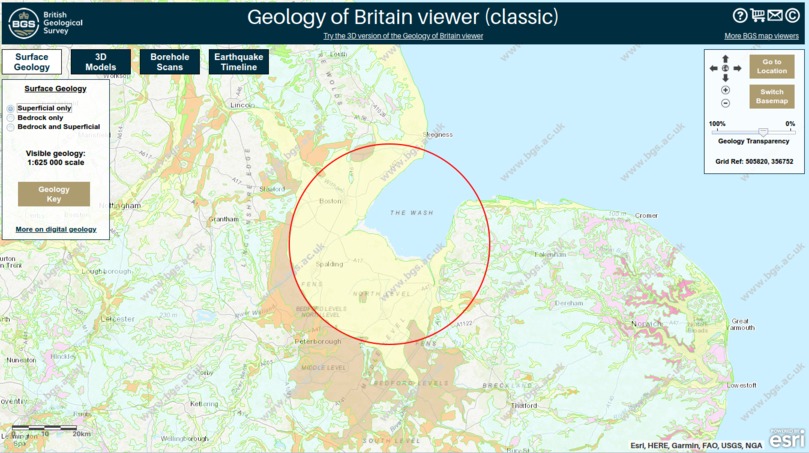
The Fens are the site of another unnatural feature: the partial circle formed by geological transitions in its near-surface geology:
Sand in the face of conventional geology. Source: On the Level About Lincolnshire - Part One
To see if the two circles are linked, superimpose the geological red circle on the map of sunken churches:
A four-ring mystery.
Key:
- White circle: Inner edge of sunken churches zone.
- Green circle: Outer edge of sunken churches zone.
- Blue circle: Second inner edge of sunken churches zone.
- Red circle: Change in near-surface geology shown on British Geological Survey map.
Dimensions:
- Red circle diameter: 62km (39 miles)
It turns out the red circle shares its centre with the centre of the arc of sunken churches.
Why would an arc that relates to geology share the same centre as an arc of reports of sunken churches?
Looking again at the British Geological Survey's map, the geological formations to the west and north of the Fens look more weirdly circular than the geological formations to the south east of the Fens.
Similarly, the destruction of buildings seems to have been worse to the north and west:

Bardney Abbey, Lincolnshire. Source: Bardney Abbey
The British Geological Survey's geology map suggests the events that created the geological transitions along the red circle were stronger in the west of the Fens and weaker in the south-east.
The scale of destruction to Lincolnshire's monastic houses seems to support this notion.
It might also explain how Santon Downham's sand flood was so well-recorded. If there were more survivors to the south and east, then their witness reports had a better chance of propagating into written records.
Accounts of Witham valley flooding suggest there was a grand-scale flood event shortly before the 19th century.
Conventional Fenland history blames the destruction on the Civil War and severe storms.
Eastern England coversands and a range of other evidence suggest there was much more to these events than just flood.
More:
- Sand Flood - Santon Downham
- A Miniature Sahara
- Shifting Sands
- Santon Downham Parish
- The Brecks Earth Heritage Trail
- Europe's Inland Seas
- Late Holocene Landscape Instability in the Breckland
- Late-Holocene Inland Dune Activity
- 1603-1790AD - Lakenheath Parish Council
© All rights reserved. The original author/creator of each image, video, quote or text retains full ownership and rights.
-
Evidence of a 1607 tsunami in the Severn Estuary is not currently considered among explanations for the sand. Despite its timing. See also: When the Sea Flooded Britain, Steve Mitchell, 2005 ↩
-
In The Torrington Diaries, John Byng mentions 18th century friends and colleagues enhancing their gardens with fake 'druidic' temples and fake 'monastic' ruins (eg at Chicksands and William Jolland's Louth 'hermitage'). In 1798, Lake District 'pioneer settler' and early tourism promoter John Pocklington had a 'Druid Stone' and a chapel erected in Borrowdale, Cumbria, near his 'Ice Age' Browder Stone. Originally considered poor taste, these artefacts are now considered part of Britain's 'ancient' past. ↩
More of this investigation:
On the Level About Lincolnshire,
More of this investigation:
The Reformation was a Reformatting
More by tag:
#geology


